Each patch gives an equal share of a portion of its value to its neighbor patches.
diffuse(world, pVar, share, nNeighbors, torus = FALSE)

# S4 method for worldMatrix,missing,numeric,numeric
diffuse(world, share, nNeighbors, torus)

# S4 method for worldArray,character,numeric,numeric
diffuse(world, pVar, share, nNeighbors, torus = FALSE)
Arguments
- world
WorldMatrixorworldArrayobject.- pVar
Character. If the
worldis aworldArrayobject,pVaris the name of the layer to use to define thepatchesvalues.pVarmust not be provided if theworldis aworldMatrixobject.- share
Numeric. Value between 0 and 1 representing the portion of the
patchesvalues to be diffused among the neighbors.- nNeighbors
Integer: 4 or 8. Represents the number of neighbor
patchesconsidered.- torus
Logical to determine if the
worldis wrapped. Default istorus = FALSE.
Value
WorldMatrix or worldArray object with patches values updated.
Details
What is given is lost for the patches.
     If `torus = TRUE`, all `patches` have `nNeighbors` `patches` around

     them, which

     some may be on the other sides of the `world`. If `torus = FALSE`,

     `patches` located on the edges of the `world` have less than

     `nNeighbors` `patches` around them.

     However, each neighbor still gets 1/4 or 1/8 of the shared amount

     and the diffusing

     patch keeps the leftover.
References
Wilensky, U. 1999. NetLogo. http://ccl.northwestern.edu/netlogo/. Center for Connected Learning and Computer-Based Modeling, Northwestern University. Evanston, IL.
Examples
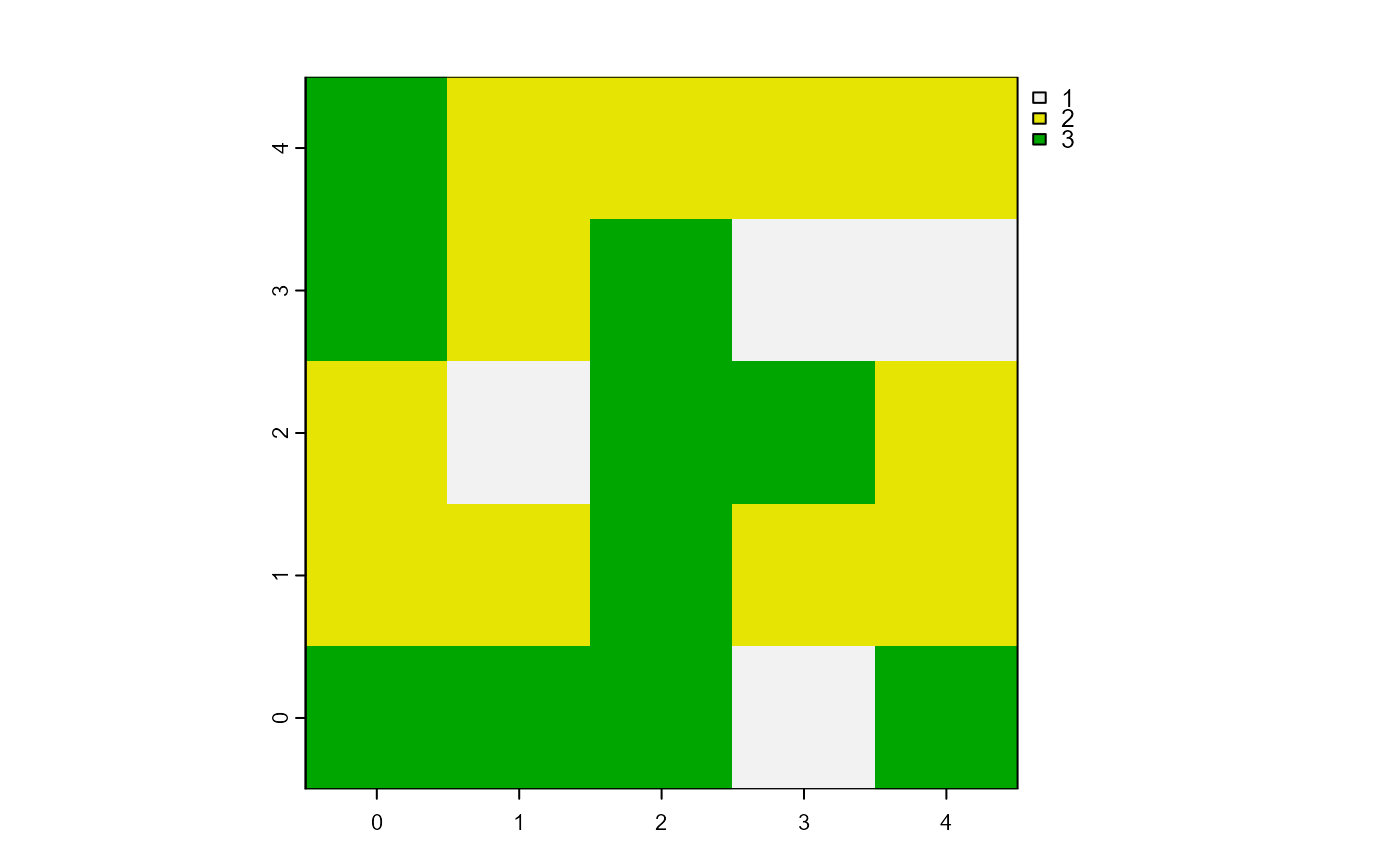
w1 <- createWorld(
  minPxcor = 0, maxPxcor = 4, minPycor = 0, maxPycor = 4,
  data = sample(1:3, size = 25, replace = TRUE)
)
plot(w1)

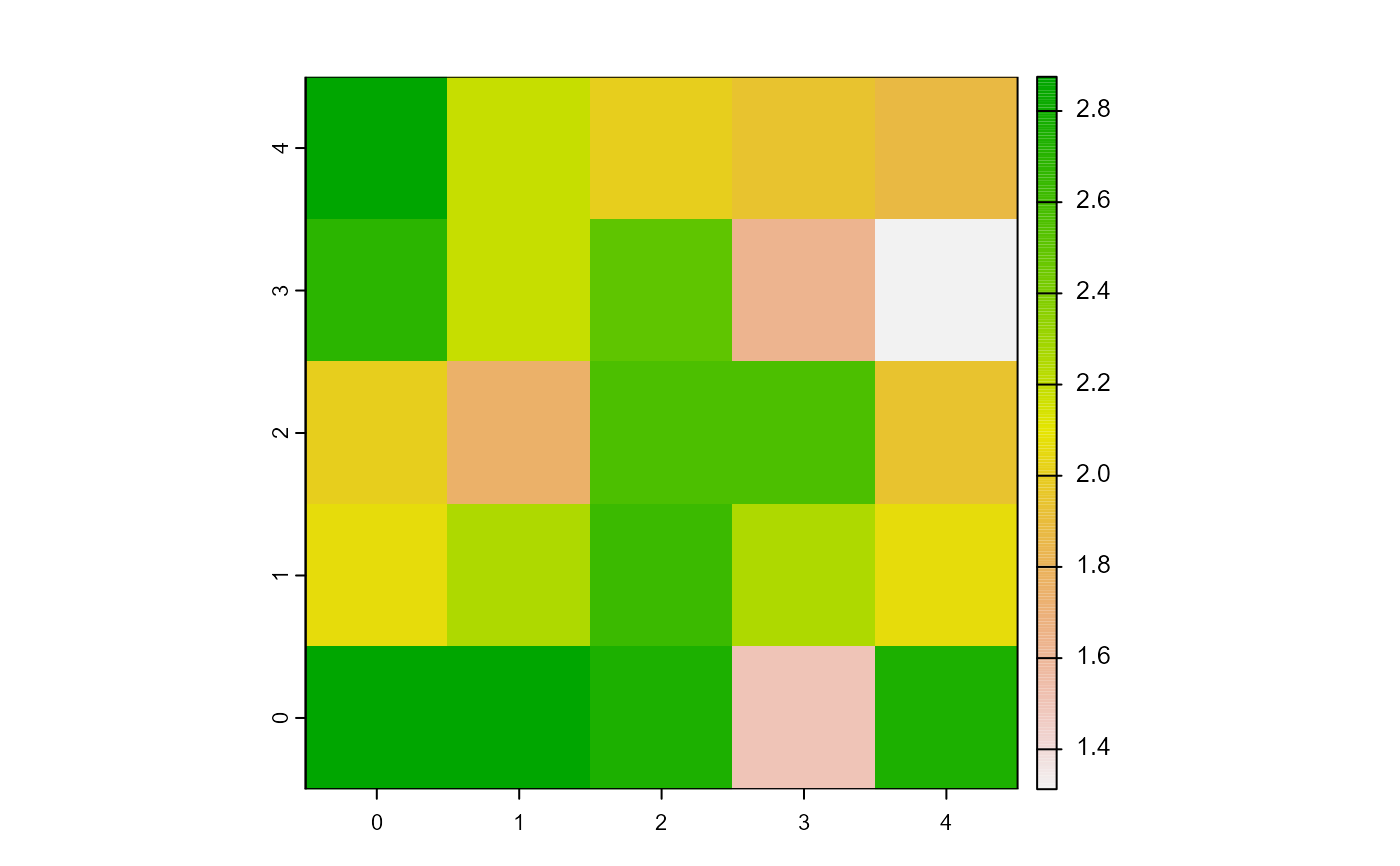
# Diffuse 50% of each patch value to its 8 neighbors
if (requireNamespace("SpaDES.tools", quietly = TRUE)) {
  w2 <- diffuse(world = w1, share = 0.5, nNeighbors = 8)
  plot(w2)
}
